

Data Discovery: Visualization Ribbon
Changes made in this tab influence the Visualization component (for the current report only).
The Visualization Tab becomes active when an Advanced component is added to the report canvas.
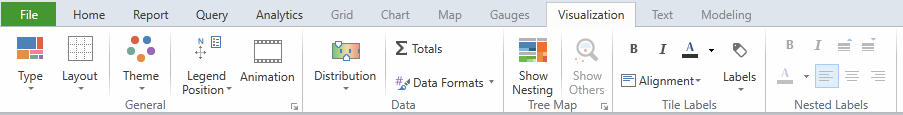
General
Type
Allows user to choose the desired visualization type from a predefined list:
- Tree Map
- Sunburst
- Word Cloud
- Circle Packing
For details, read about the Visualization types.
Layout
Provides layout options:
- Single Visual - Displays a single visual within the Visualization panel.
- Multiple Visual - Displays multiple visuals within the Visualization panel. This button becomes active when multiple levels of data are present in columns. There are two selection options:
- Auto Trellising - Provides automatic trellising. The system determines automatically the desired number of visuals (1-6) to place in a single trellis row. Visuals are based on data columns in the source grid.
- Number of Columns - Allows user to specify the desired number of visuals (1-6) to place in a single trellis row. Visuals are based on data columns in the source grid.
Theme
Applies a predefined color theme to the Visualization component in the current report.
NOTE: Changing the Report Theme in the Report Tab overwrites the current Visualization Theme. Therefore, it is recommended to first set the Report Theme, and then (if desired) to change the Visualization Theme.
Legend Position
Positions the legend within the Visualization component .
Animation
Turns on animation for first-time display of the visualization query. Animation design varies depending on visualization type. Animation provides a more interactive user experience, but can slow down query speed.
Data
Distribution
Changes the data distribution method employed by the color legend.
- Continuous - Legend employs a continuous color spectrum.
- Discrete - Legend employs a specific number of colors (in range 2-9).
Totals
Use the Data Discovery/Query/Totals command to configure which totals you want for the current report.
Use the Totals command in the Visualization tab to turn on/off the display of totals for the Visualization component for the current report (has no affect on the configuration of totals).
Data Formats
Determines the data display format:
- Auto Format - Displays data in a user-friendly fashion. For example, the value 3,100,097 would be displayed as "3.1 M".
- Measure Format - Displays data exactly as it appears in the cube.
Tree Map
Show Nestings
Toggles row nesting on/off.
NOTE: This command is enabled when sub-rows are present in the current query.
Show Others
Displays/hides statistically insignificant rectangles. These rectangles are hidden because they represent a very small percentage of the overall Tree Map. When hidden, the rectangles are removed from the overall Tree Map calculations. When displayed, they are included in the calculations and are aggregated into a single rectangle referred to as “Others”.
IMPORTANT: When Show Nestings is selected, a WARNING ICON may sometimes appear inside of the Visualization panel. The WARNING ICON indicates that some nesting borders have been removed from the active display. The value of such nesting borders is so small, that it is impossible to display them in a proportionally correct manner. When removed from the display, these nesting borders are not part of the overall Tree Map calculations. You can click the warning icon to see a list of these nesting borders. When you de-select Show Nestings, the rectangles contained in these nesting borders return to their normal status and can be part of the display.
Word Cloud
Word Scale
Determines the method used for word scaling:
- Linear - Creates Word Cloud using a simple linear algorithm - meaning words are displayed in direct proportion to the actual data size.
- Power - Creates Word Cloud using a power algorithm to emphasize differences. Causes relative display size of larger elements to be increased.
- Log - Creates Word Cloud using a log algorithm to de-emphasize differences. Causes relative display size of larger elements to be decreased.
Labels Word Cloud
The following label options are available for the four Visualization types:
| VISUALIZATION TYPE |
ELEMENT | FONT STYLE |
BOLD | ITALIC | FONT COLOR |
FONT SIZE |
ALIGNMENT | SHOW / HIDE |
PADDING |
|---|---|---|---|---|---|---|---|---|---|
| Tree Map | Tile Labels |
YES | YES | YES | YES | YES | |||
| Nested Labels |
YES | YES | YES | YES | YES | ||||
| Sunburst | Center Labels |
YES | YES | YES | YES | ||||
| Ring Labels |
YES | YES | YES | YES | YES | YES | |||
| Word Cloud
|
(text) | YES | YES | YES | |||||
| Circle Packing | Circle Labels |
YES | YES | YES | YES | YES |
Home |
Table of Contents |
Index |
User Community
Pyramid Analytics © 2011-2022